Volume Data
Dashboards and views for data performance management
Overview
Volume is part of an internal product at AMBEV, focused on visualizing the performance of the company’s brands across multiple countries. The goal is to optimize the data analysis process by eliminating the need for manual slide decks and instead centralizing all information in an interactive dashboard that simplifies performance tracking and visualization.
ROLE
Product Designer
TOOLS AND SKILLS
TEAM
Analytics
TIMELINE
September 2024
The challenge was to design a digital solution that centralizes and visualizes the performance of AMBEV’s brands, replacing manual data presentations with an interactive dashboard. The main UX goal was to streamline the delivery and sharing of insights, ensuring an intuitive experience and enabling users to quickly navigate and understand key performance data.


Challenges
Transforming 33 slides of complex and scattered data into a functional dashboard with a clean, user-friendly interface. The focus was on improving data comprehension and reducing cognitive load through clear visual hierarchy and intuitive navigation.
The goal was to ensure a seamless user experience by enabling interaction within a single view, avoiding the need for multiple tabs, reducing excessive scrolling, and optimizing the way data is displayed for quicker insights.
The process involved understanding and aligning the needs of multiple teams — from analysts to management — by reconciling conflicting inputs and continuously iterating on the data structure to ensure clarity, accuracy, and relevance for all user profiles.
The goal was to create a clear and concise data visualization solution, emphasizing impactful charts and a narrative-driven approach to help users easily interpret and engage with the data.
Process
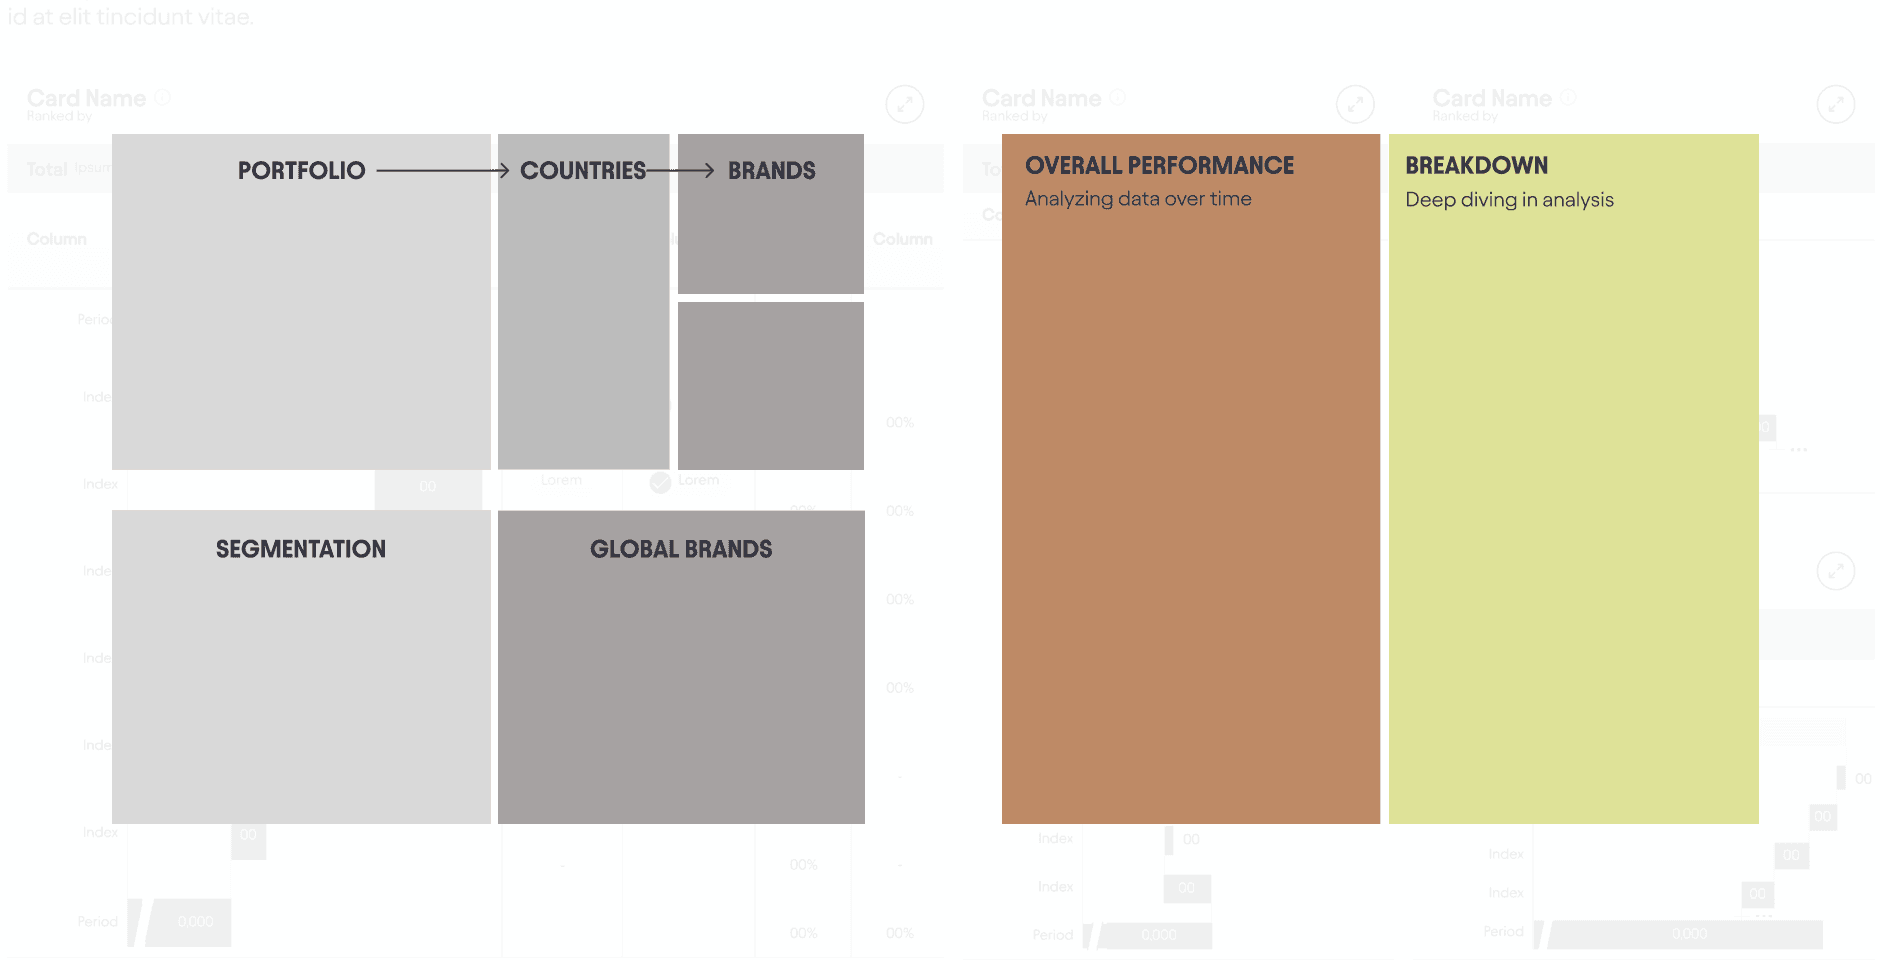
The process involved continuous communication and validation with the analysts and management teams. We started with an initial meeting to understand the project requirements, followed by a detailed study of the data and documents provided by the team. From there, we created sketches and prototypes based on UX principles and data visualization techniques, using charts such as waterfall and bar charts. The development cycle included technical validation with developers, feedback collection, continuous revisions, and the final handoff.


Interactions
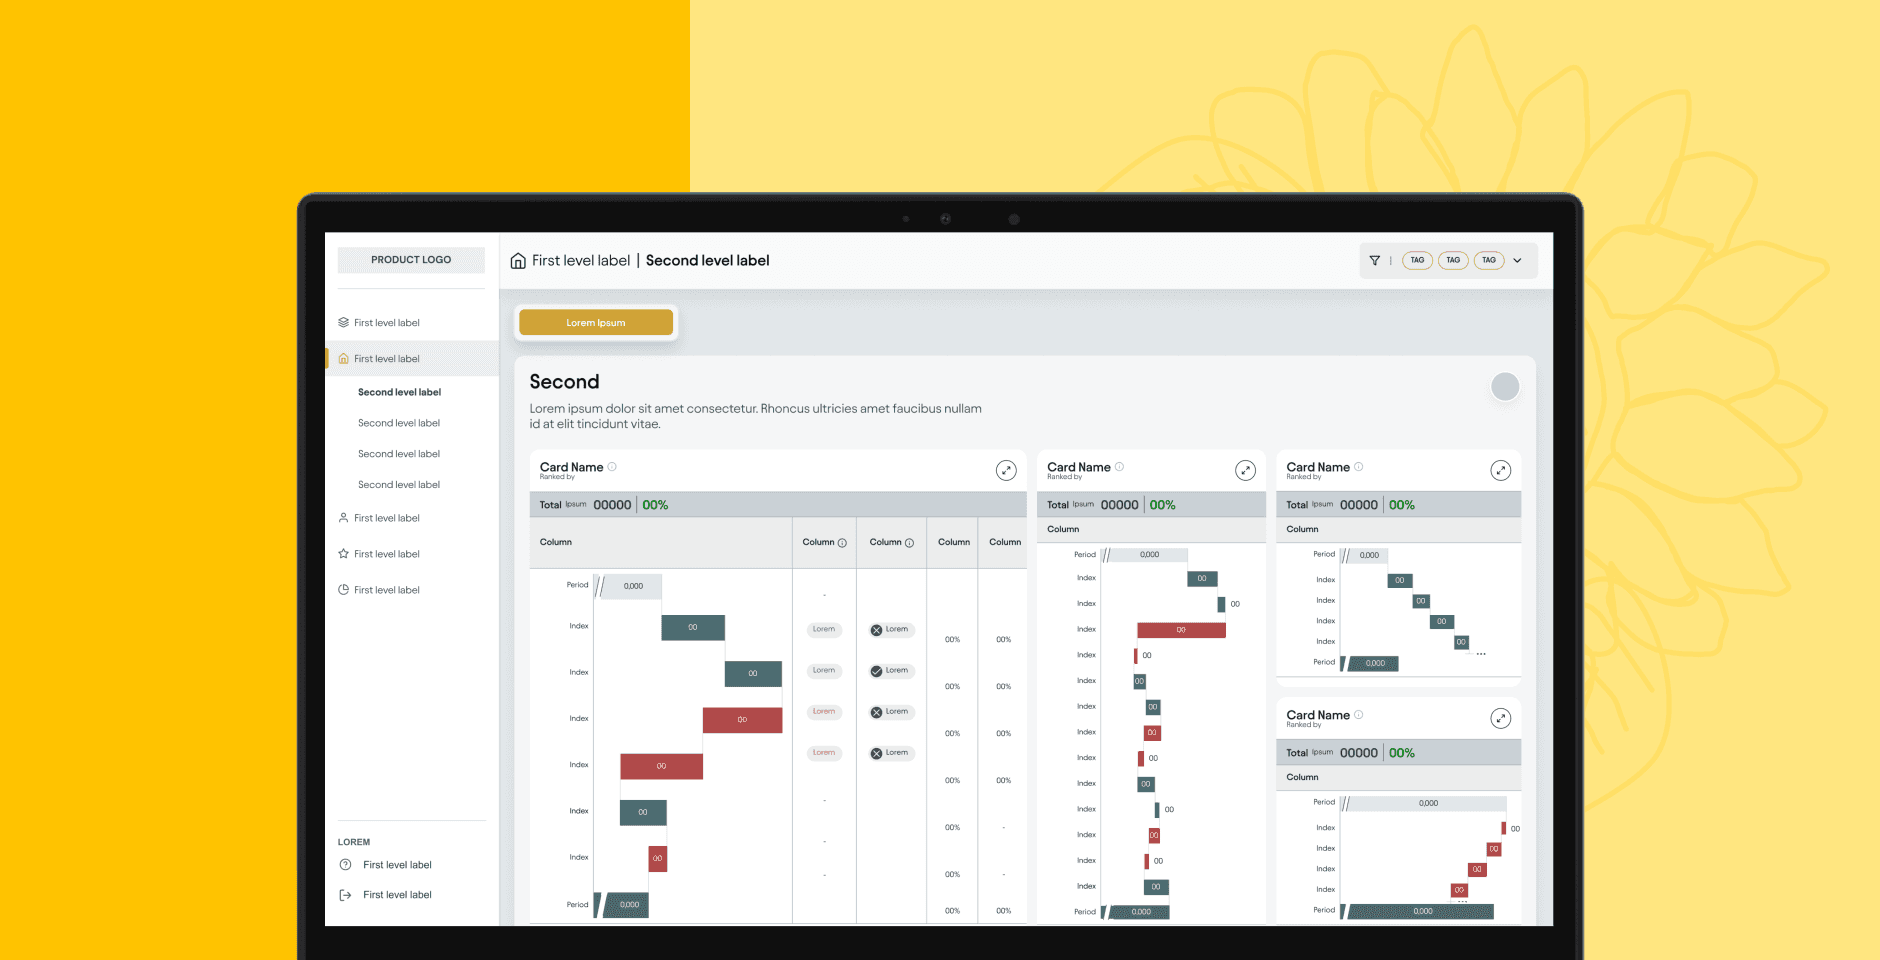
All interactions were designed so users wouldn’t need to leave the main screen. We used expandable cards that displayed data compactly, allowing easy navigation and quick access to information without the need to open new tabs or scroll excessively. The layout was crafted to ensure that key information was always just one click away.


Key Results
We transformed 33 scattered slides into a cohesive data storytelling experience through a dashboard with 6 expandable cards, enabling clear, intuitive insights in just a few clicks.
The analysts' team expressed high satisfaction with the streamlined experience, eliminating the need for multiple tabs and allowing quick, intuitive access to data comparisons.
The solution is expected to reduce information handoff time by at least two days, replacing a previously manual and time-consuming process.
Estimated to cut handoff time by 2+ days, replacing manual data sharing
Learnings
This project strengthened my experience in data visualization, deepening my understanding of how to design, interpret, and communicate data effectively through clear and meaningful charts.
Reinforced the importance of patience and organization when collecting and structuring information — especially when working with diverse and complex datasets.
Experience reinforced the importance of designing clear navigation flows and a straightforward information architecture to ensure the dashboard’s usability and clarity.